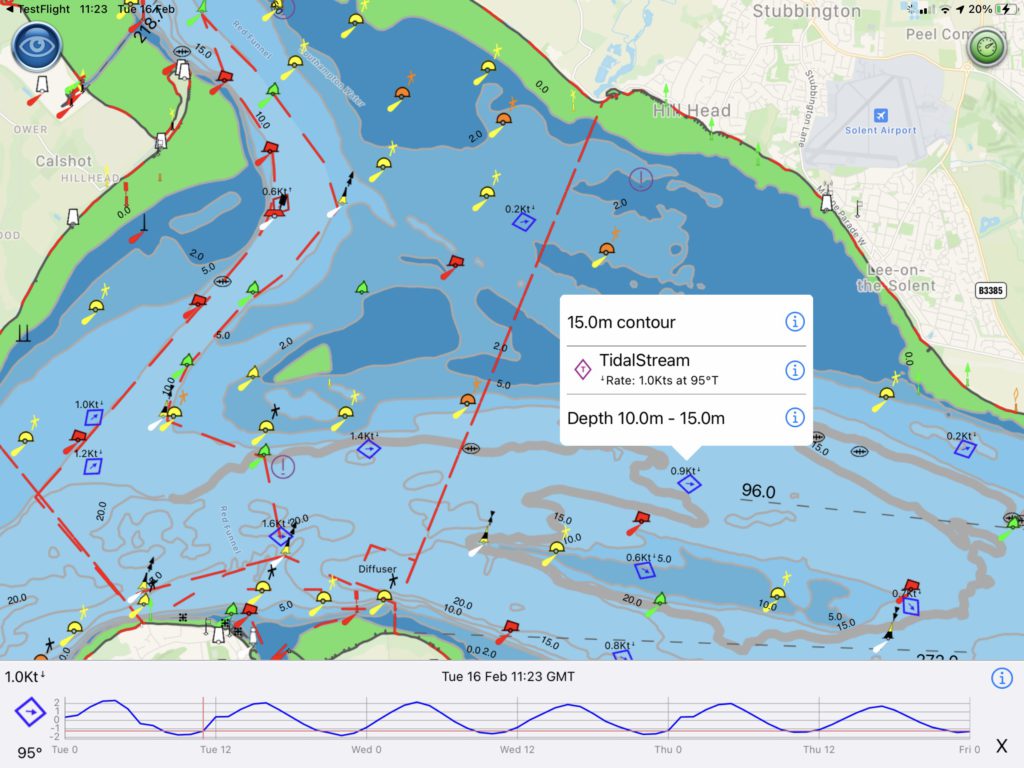
You can now view the current and predicted tidal flow rates and directions live on SeaNav’s UK and IE vector charts.

We use the official chart Tidal diamond symbol, rotating it to point in the flow direction. Blue means the rate is decreasing, red and its increasing. The diamonds update in real time on the chart. For planning tap on a tidal diamond to see the rate and direction, tap i for more information and see the rate and direction for the next 3 days on a graph at the bottom of the screen. Slide the time cursor ( or just tap at the time you want ) and all the tidal diamonds in view on the chart update as you adjust it (not just the one you have selected). You can zoom in and out of the graph timeline using pinch gestures. The Tidal Stream information is cached for up to 7 days so will work when you are out. of internet coverage as well.
The new Tidal Stream feature requires SeaNav 5.3 or later and uses official data from the UK Hydrographic Office, updated annually. A current UK & IE chart subscription is required to view the data. We hope to add Tidal Streams for other areas where available if they prove popular ( FR, NL & BE, DE… ). Please email us and let us know.
